Some of you may know of my personal interest for SVG interaction in APEX applications. I have been working with a JavaScript library called
"Raphaël" (RaphaelJS, raphael.js or just raphael) for a while now. It is an amazing plugin to create all kind of customized business solutions. But before I show you how I have used Raphaël I tell you how I came to the technology and what happened in the last few years.
5 years ago an APEX developer called "
Matt Nolan" created an impressive example how you can use Raphaël for a custom business case:
SVG Body Chart Plugin
Inspired by his example I started looking for this library called Raphaël.
What does the library do?
It creates dynamic SVG graphics with Javascript and JSON.
Why is it so special?
From an APEX developer point of view it gives you great possibilities to create SVG graphics right from the data out of your database and Raphaël itself brings you several ways to create more or less complex solutions. Just go on reading and you will find out.
How to integrate Raphaël?
Upload the JavaScript file and include it in your APEX page.
/* Implementation: Page > JavaScript > File URLs */
#APP_IMAGES#raphael-min.js
Add a new APEX region from type "Static Content" and add a DIV element:
<div id="svg_example1"></div>
Finally add the Raphaël-JavaScript code below the DIV region:
<script>
  document.addEventListener("DOMContentLoaded", function(){
    /* Set up raphael svg area and save it in variable rc (raphael container)*/
    var rc = new Raphael(document.getElementById('svg_example1'), 200, 180);

    /* add new svg element */
    var el = rc.path("M 170 120 l 0 -50 l -50 0 l 0 -50 l -50 0 l 0 50 l -50 0 l 0 50 z");

    /* Add attributes to element */
    el.attr(
        {
            fill: '#F2621B',
            stroke: '#2F3E66',
            'stroke-width': 10,
            'stroke-linejoin': 'round',
            rotation: -90
        }
    );
 }, false);
</script>
Result:
 Who made this library?
The developer behind Raphaël is
Dmitry Baranovskiy. Compared to the APEX community he is the
Patrick Wolf for SVG solutions using JavaScript. At least in my mind. :)
After the success of Raphaël he joined Adobe. There he created an library called
Snap which is quite similar to Raphael and real powerful. Unfortunately it seems that the Snap library is not further developed anymore. The last release is from 2 years ago.
Support?
The last
Raphael release is from July 2016. Having questions use "
Stack Overflow".
Why not creating the same kind of solution as Matt did?
It took me a while before I had the time thinking about the possibilities and purpose in business applications. I mean not every developer can create an example as Matt did. So I had some reasons to consider about:
1. No sources available
The typical company does not have SVG graphics to visualize their custom business situations. Mostly they use some advanced Excel files including some graphical parts to visualize their business cases. So if you create an APEX application based on those Excel solutions, the customers want their "beautiful" visualization in the APEX application as well.
For example an "workshop plan".
2. Complexity
It is really complicated to create a SVG graphic for the typical APEX developer.
Interacting with SVG graphics is also not the typical activity for an APEX developer.
Moving an SVG to the database to build it with Raphael is not easy either.
You may have to use Raphaël with other JavaScript libraries to enhance the user experience.
3. Time and Money
The more complex the example the more times it takes creating a result and it will become more expensive in the first run and on future updates.
4. Maintenance
Could a decent APEX developer take my solution and extend it? This is an important question to me.
What did I do?
2 Years ago I created an example application for the DOAG 2014.
There I published several examples how you can use Raphaël on top of an existing image file. I only created a few moving SVG components to interact with the application user.
Advantages:
- It is really easy to integrate.
- You do not need an SVG out of your Excel file to publish it in APEX.
- Less code because of the static background image
Disadvantage
- The image can't be responsive
- It can never be as beautiful as the example from Matt
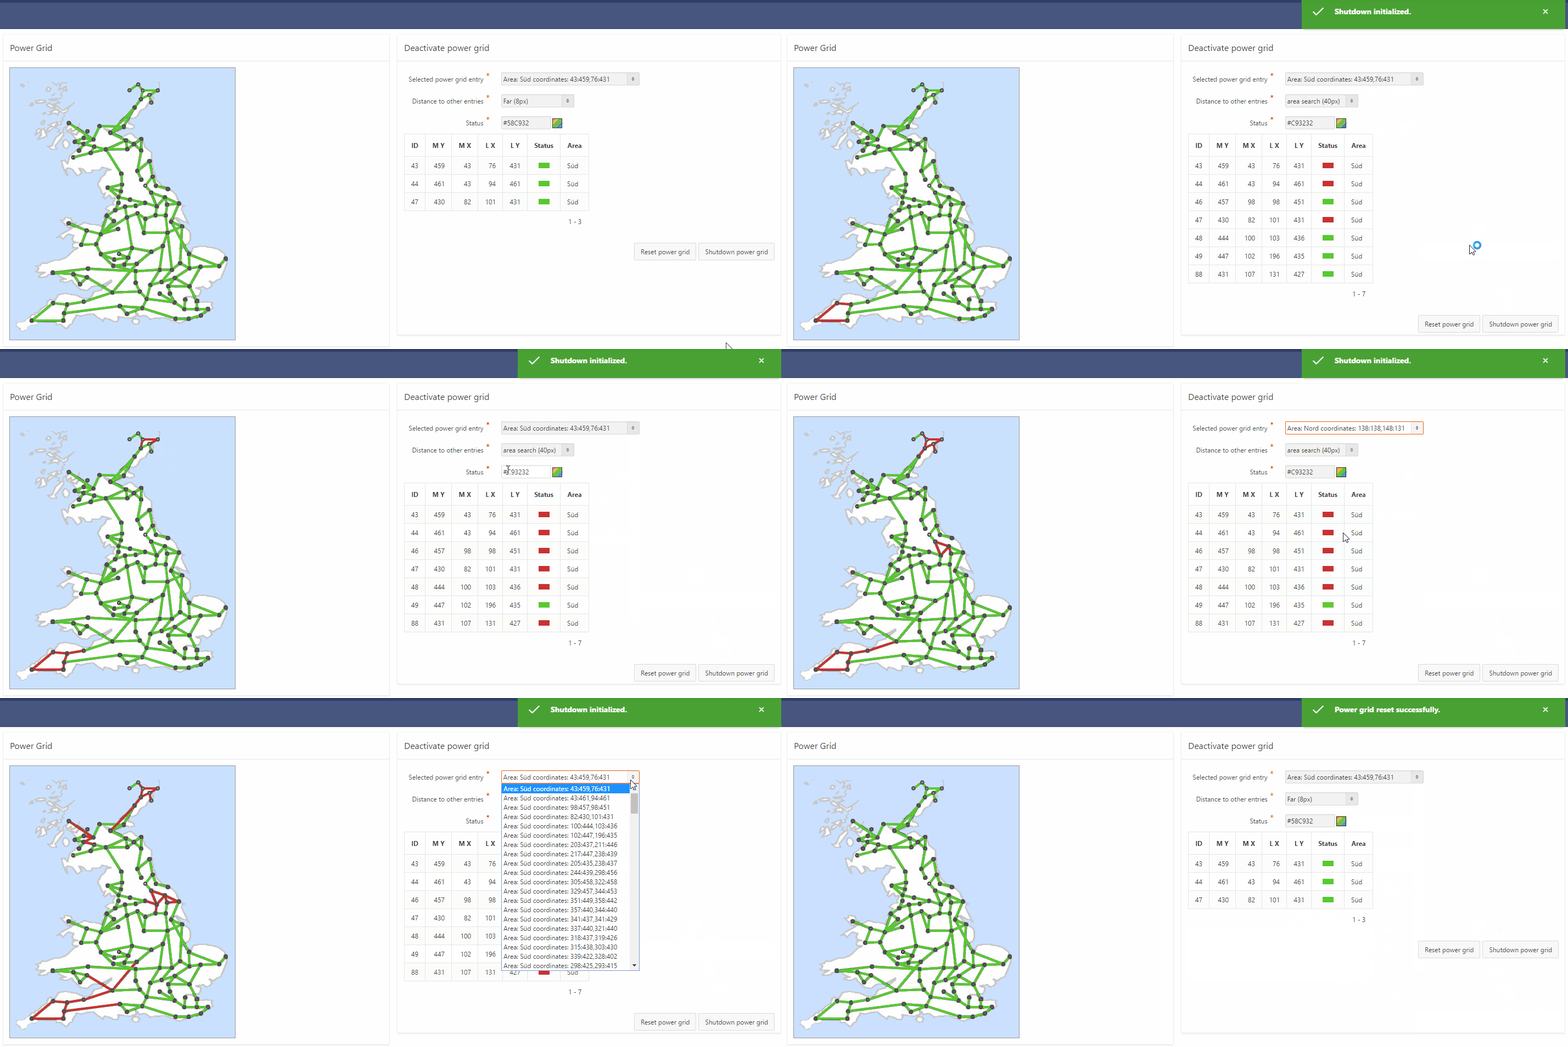
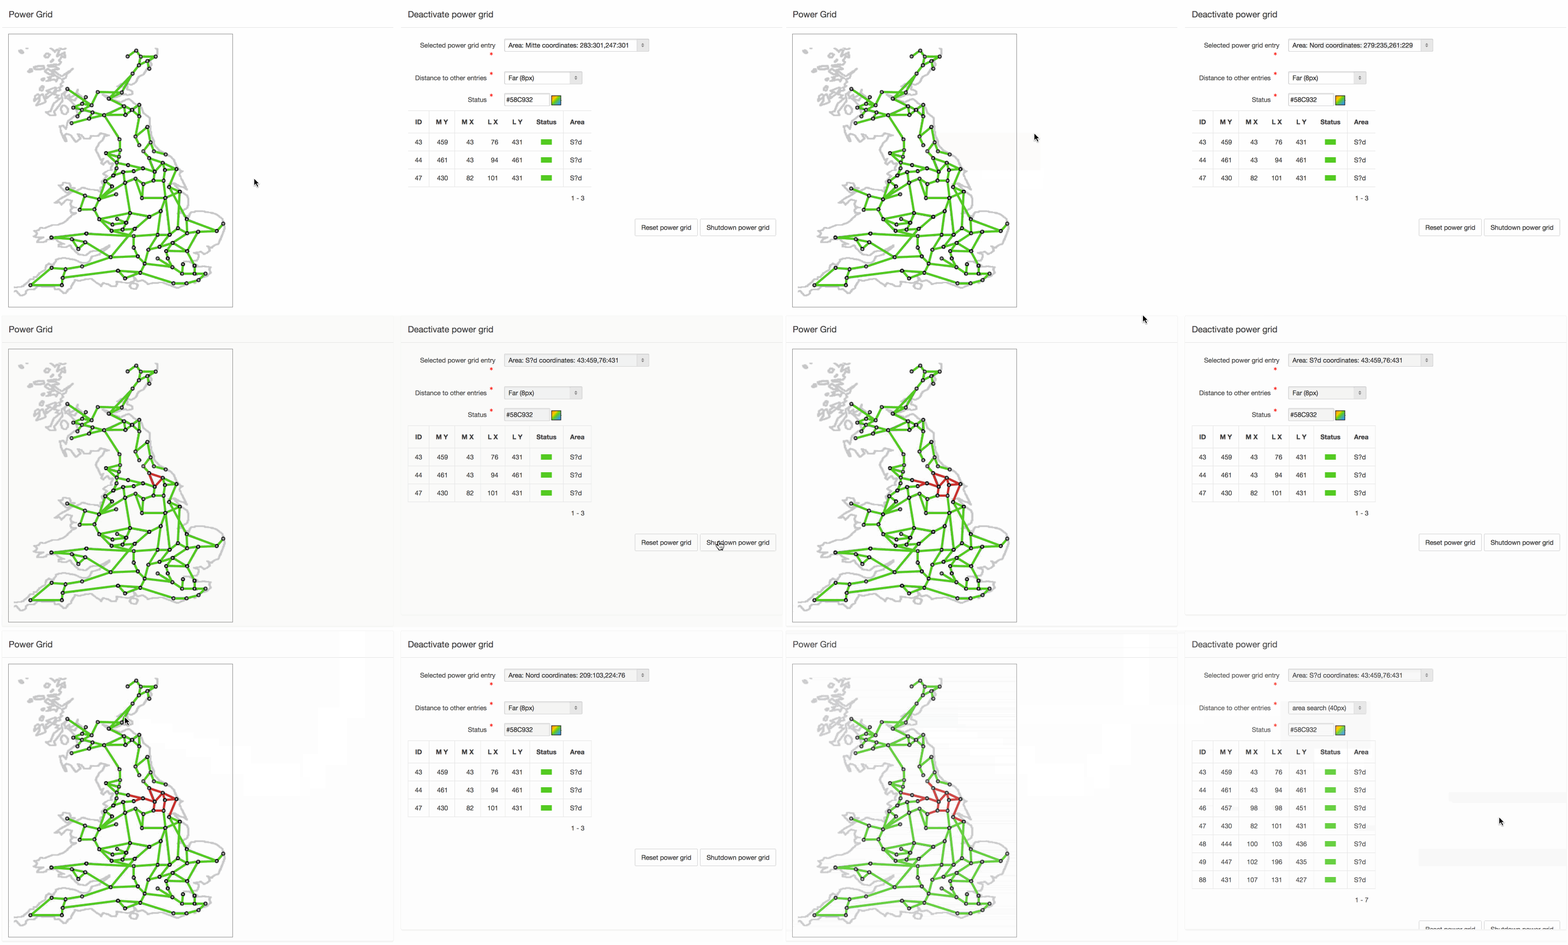
The solutions looked like this:
Harbor example (Source: marinafuehrer.adac.de)

Bridge example (Source: dresden.de)

Power grid example (Source: Dirk Witthaut, MPI für Dynamik und Selbstorganisation, ds.mpg.de)

The image, the data and the Raphael code comes directly from inside the database. Published with a PL/SQL procedure:
procedure generate_harbor (in_image_id number)
is
  v_image_filename           varchar2(100);
  v_image_name                varchar2(100);
  v_image_width              number;
  v_image_height               number;

  v_background_color varchar2(100);
begin
  s_proc_name := 'RJS_DEMO.GENERATE_HARBOR';
  s_parameter := 'in_image_id: ' || to_char(in_image_id);

  s_action := 'Image selection';
  select image_filename, image_name, image_width, image_height
  into   v_image_filename,v_image_name,
         v_image_width, v_image_height
  from   rjs_image
  where  id = in_image_id;

  s_action := 'HTML generation';
  htp.p('
   <style>
    #wrapper {
        position: relative;
        width: ' || v_image_width || 'px;
        height: ' || v_image_height || 'px;
        padding: 0;
        outline: 1px solid #999;
    }
    #wrapper img {
        position: absolute;
        top: 0;
        left: 0;
    }
    #canvas{
        position: absolute;
        top: 0;
        left: 0;
    }
   </style>
   <div id="wrapper">
    <img src="' || v('WORKSPACE_IMAGES') || v_image_filename ||'">
    <div id="canvas">
    </div>
   </div>
   ');


  s_action := 'JS open';
  htp.p('
   <script>
    document.addEventListener("DOMContentLoaded", function(){
      var canvas = Raphael(document.getElementById("canvas"), ' || v_image_width || ', ' || v_image_height || ');
  ');

  s_action := 'JS data loop';
  for rec_k in (
         select rownum, image_id, coordinate_id,
                result_type, text, c_x, c_y, c_t, c_x_text, c_y_text
         from vw_rjs_harbor
         where image_id = in_image_id
  ) loop

      s_action := 'txt'||rec_k.rownum || ' generation.';
      htp.p ('
        var txt'||rec_k.rownum||' = canvas.text('||(rec_k.c_x_text)||', '||(rec_k.c_y_text)||', "'||rec_k.text||'");
        txt'||rec_k.rownum||'.attr({ "font-size": '||'"9"'||','
                                   || ' "font-family": "Arial, Helvetica, sans-serif",'
                                   || ' "fill": "black",'
                                   || ' transform:"r-'||rec_k.c_t||'"});
        var box'||rec_k.rownum||' = txt'||rec_k.rownum||'.getBBox();
        var img'||rec_k.rownum||' = canvas.image("'|| v('WORKSPACE_IMAGES')||rec_k.result_type||'.png", '
                                                   || rec_k.c_x||', '||rec_k.c_y||', '||'26'||', '||'19'||')'
                                                   || '.attr({transform:"r-'||rec_k.c_t||'"}).glow({width:1,opacity:0.8});
        txt'||rec_k.rownum||'.toFront();
        ');

  end loop;

  s_action := 'JS close';
  htp.p('
    }, false);
   </script>
  ');

exception
when others then
      rollback; s_ora_error := sqlerrm;
      s_custom_error := 'Internal error occured. Processing stopped.';
      add_err; commit;raise_application_error(-20001, s_custom_error);
end;
APEX itself needs a region from type: "PL/SQL Dynamic Content"
The source is simple:
RJS_DEMO.GENERATE_HARBOR (:P11_IMAGE_ID);
The result looked like this:
 From my point of view:
You get a new way publishing data in a decent amount of time and low complexity in the source code.
This was two years ago.
On this years DOAG 2016 I will tell you how you can achieve even more powerful examples.
Using the Raphael extension
Mapael for custom map visualizations or how to create an own SVG and convert it real fast towards APEX. And maybe there will come some more...

See you at DOAG.
And for all who will miss the DOAG event. I plan to publish an open source version of the application. So check
apex.world at the end of the year. Maybe 24. of December will be a good date. :)